
- Designate a central location for all facility contamination and radiation data
- Alleviate the use of paper for reporting contamination and radiation levels.
- Eliminate redundancy and manual input of data from paper surveys
- Provide more thorough and accurate contamination trending
- Provide more thorough and accurate contamination trending
- Facilitate data requests from regulators and auditors
- Reduce operating costs from waste, manpower, and re-works
- Link exposure, waste, and work management databases to provide a “full story” of upset conditions
Introduction
Today’s society is in a constant state of technological infatuation where people must always be connected, and many industries and businesses have capitalized on the improvements, decreased cost of technology, and the ubiquitous connectivity in mobile technology. For most industries and businesses, the age of the Internet of Things (IoT) is a welcomed revolution, and it provides employees the opportunity to work more efficiently and facilitates the overall maintenance of the work-life balance. However, when it comes to businesses and agencies confined to operate in secure environments where information and operational security are of the utmost importance, the ability to take full advantage of technological improvements becomes severely hindered. Although the challenges to overcome these hindrances appear impossible, the task of working through the hurdles can be accomplished with the right project team and support.
Within certain secure environments the use of electronics with embedded cameras are strictly prohibited unless there is an essential business need, and even if there is a legitimate reason for obtaining such a device; the approval process can be unsuccessful if one person cannot agree to the required conditions. To mitigate the information and operational security risks, the path forward was one of least resistance where the Information Technology Department was tasked with researching the feasibility of obtaining a tablet computer with no embedded camera installed or where the camera could be easily removed, would easily conform to the business’ current datacenter infrastructure, and meet all requisite information security policies.
Although the challenges to overcome these hindrances appear impossible, the task of working through the hurdles can be accomplished with the right project team and support.
Once a tablet computer had been identified and purchased, field testing of the device was conducted to ensure the tablet would meet the needs of the technicians utilizing them. With the decision to accept the purchased tablet for use, the Information Services Department began gathering requirements to design appropriate software. The primary concerns regarding the software development began with meeting regulatory requirements, data validation and retention, user friendly interfaces, and obtaining requisite electronic signatures through user’s network login credentials.
Development of an electronic survey and data retention system proposed to alleviate the use of paper surveys, significantly reduce the requirement for manual data entry, provide more thorough and accurate trending, facilitate contamination trend requests from outside inspectors, and reduce operating costs from waste, manpower, and re-works from lost paperwork. The tablet software design criteria began foremost with ensuring users could easily navigate the system without confusion, and eliminate human error factors with data validation and electronic transfer from automated counting equipment. The survey system requires the ability to store surveys and survey data electronically using Microsoft Structured Query Language (SQL) Server as the backend database. Using a structured relational database like Microsoft SQL Server allows data to be easily accessed and queried, and allows for any survey to be retrieved upon request.
Materials and Methods
Microsoft Windows based (Microsoft Corporation One Microsoft Way, Redmond, WA 98052) (Microsoft.com) Motion Computing J3400 Tablet PC without cameras (MotionComputing.com), J-Series FlexDock docking station (MotionComputing.com), J-Series Work Anywhere Kit (MotionComputing.com), and Series 5 XLB: Low-Background Alpha and Beta Counting System (Canberra Industries, Inc. 800 Research Parkway, Meriden, Connecticut 06450) (Canberra.com), Eclipse software (Canberra Industries, Inc. 800 Research Parkway, Meriden, Connecticut 06450) (Canberra.com), along with Microsoft SQL Server to store and backup all data collected. The tablet application, SWIPES Mobile, used for creation of contamination and radiation surveys, and a web browser based application for supervisor review and report generation was developed by in-house software engineers.
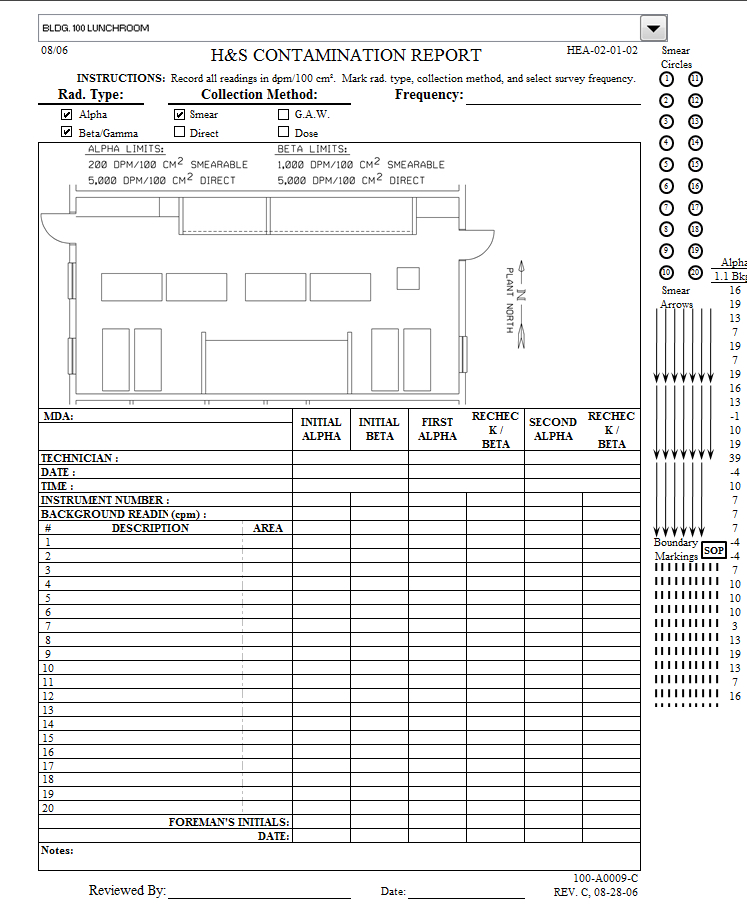
Initially, the project became a goal for the Radiation Technician (RT) Human Performance (HuP) Steering Committee as a solution to reduce and eliminate error-likely situations, use of outdated contamination or radiation survey forms, and loss of paperwork. Discussions with Information Services resulted in a wait time of nearly six years before a software engineer would have a chance to look at it, and, consequently, the Steering Committee determined in the interim an appropriate path forward would be to either explore commercial options or design a working protocol within the Radiation Technician group. The first phase of the project began with replicating the current paper surveys which were designed on Computer Aided Design software and maintained by the drafting department, and redesigning them in a usable software already available to all employees. Microsoft Excel was chosen to initiate the design which allows for data entry, insertion of graphics, and the ability to write Visual Basic code for automation.
The early stages of the design focused on routine building or area contamination surveys to serve as a proof of concept for electronic data capture and storage. The survey forms included an architectural image overlay, numbered circles, drawing tools, and a grid to input the survey location, result, and data validation against predetermined limits. Each building or area required an individual Excel spreadsheet and users could select the desired one. When conducting a survey, technicians drag circles to the desired survey location, draw any equipment or boundary demarcations, and document the results and comments accordingly. Following completion of the survey, technicians would print out and submit to supervision for review and approval.
Progressing through the project presented a number of enhancements to assist with streamlining the process of survey creation and data management. The most notable enhancement was the use of Visual Basic for Applications code to automate data transfer from Canberra’s Tennelec Low-Background counting systems. The Tennelecs utilize Canberra’s Eclipse software for viewing batches and data. Microsoft Access is used for the backend database of Eclipse, which allows for simple querying of tables to extract requisite data for calculations, recall of particular batches, and automatic input into predetermined cells.
Progressing through the project presented a number of enhancements to assist with streamlining the process of survey creation and data management.
Consequently, the ability to have Excel effectively communicate with Access databases provided the opportunity to enhance the survey forms with buttons, drop down menus, and superimposing area map images automatically. Incorporation of Visual Basic for Applications programming language reduced overall spreadsheets to one, greatly improving document control, and eliminated transcription errors with automated data transfer. Accomplishing these milestones provided a working prototype for Information Services to review and understand the fundamental requirements, and presented senior management with a viable prototype to support further development. (Figure 1)
The second phase of the project initiated design requirements for a software engineering team to build the foundation for databases, desktop applications, and an intranet based web application. The primary focal points of the project were to ensure regulatory compliance utilizing data retention, validation, and retrieval of any and all records, and a user-friendly method to query data given a date range, area, survey type (routine, investigative, intensive, or Radiation Work Permit), or Radiation Technician performing the survey. Recalling and safeguarding data was accomplished by utilizing a backend server running Microsoft SQL Server, enabling routine backups of data every hour, and development of predefined reports. Servers are maintained in a secure datacenter and access to electronic data is limited to select personnel through multiple layers of security permissions.
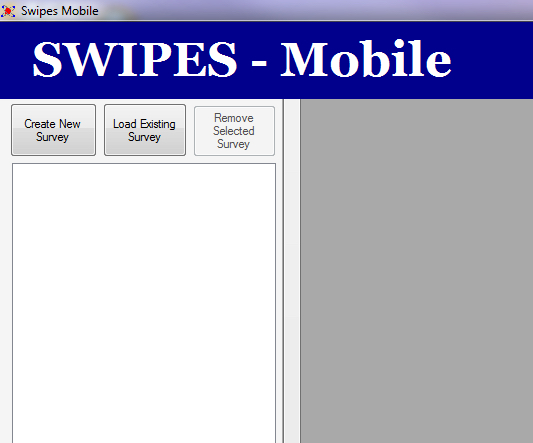
The next phase included developing a desktop application with simplicity and usability as the priority. Creating a user interface too complicated with features causes confusion, consternation, and an unwillingness to learn or use the system, which, consequently, guarantees implementation will not be successful. The desktop application was designed to be simple and flow sequentially based on company procedures and allowing three buttons as the only method to interface with the software. Users are only allowed to create a new survey, load an existing survey, or remove a survey already in queue for a particular computer or tablet.
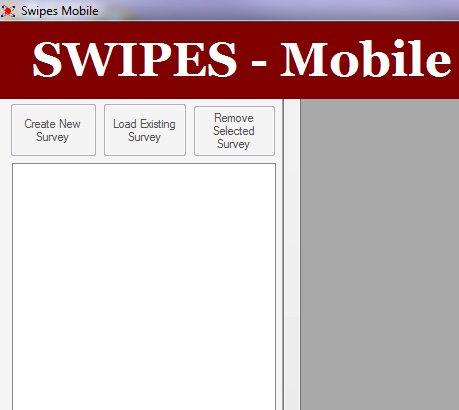
Since the desktop application was designed to be used on a tablet computer either connected to the business network or unconnected, some features were built into the software to restrict certain options and prevent errors. As shown below the left picture demonstrates the options available when connected to the Local Area Network (LAN), and the right picture demonstrates when not connected to the LAN. When unconnected the software removes the options to create or load a survey, and the title banner changes from blue (Figure 2) to red (Figure 3) for a visual indicator.
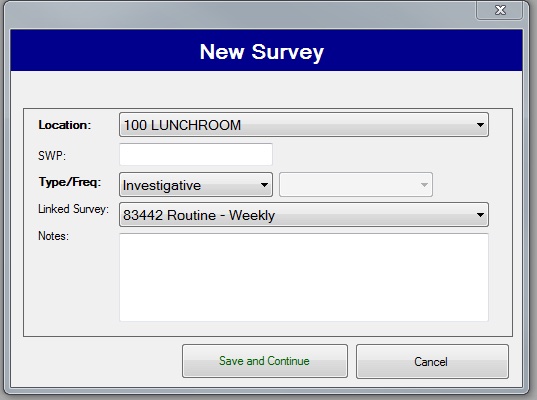
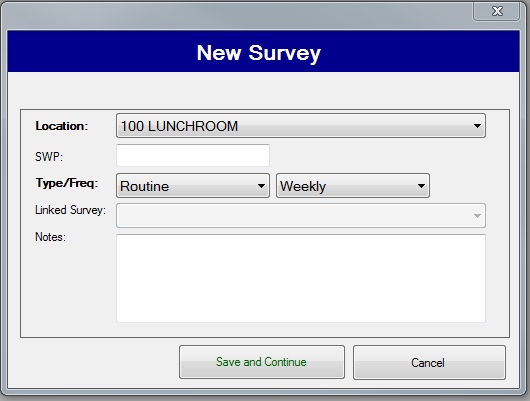
To create a new radiation or contamination survey, the technicians select Create New Survey button option which displays a pop-up box asking for Location, SWP (Safety Work Permit), Type, Frequency, Linked Survey, or Notes associated with the particular survey. To ensure accuracy and completeness some features prepopulate data based on a certain input. A technician can select a “Location”, select “Routine”, and the “Frequency” will automatically populate the preset frequency of daily, triweekly, biweekly, weekly, monthly, quarterly, semi-annual, or annual, but the user has the option to change the frequency if guided by supervision to do so.
If technicians are performing surveys other than “Routine”, the software recognizes the input and allows for surveys to be linked together in a hierarchical method. For example, one can conduct a “Routine” survey and find contamination above preset area action levels, perform intensives to determine the extent of contamination, or investigate further if directed to, and all surveys can be linked together as a group. Linking surveys together provides radiation protection staff and investigators the ability to understand the extent of contamination, assisting in determining a root cause, and greatly reduces man-hours collecting data for analysis. (Figure 4 and Figure 5)
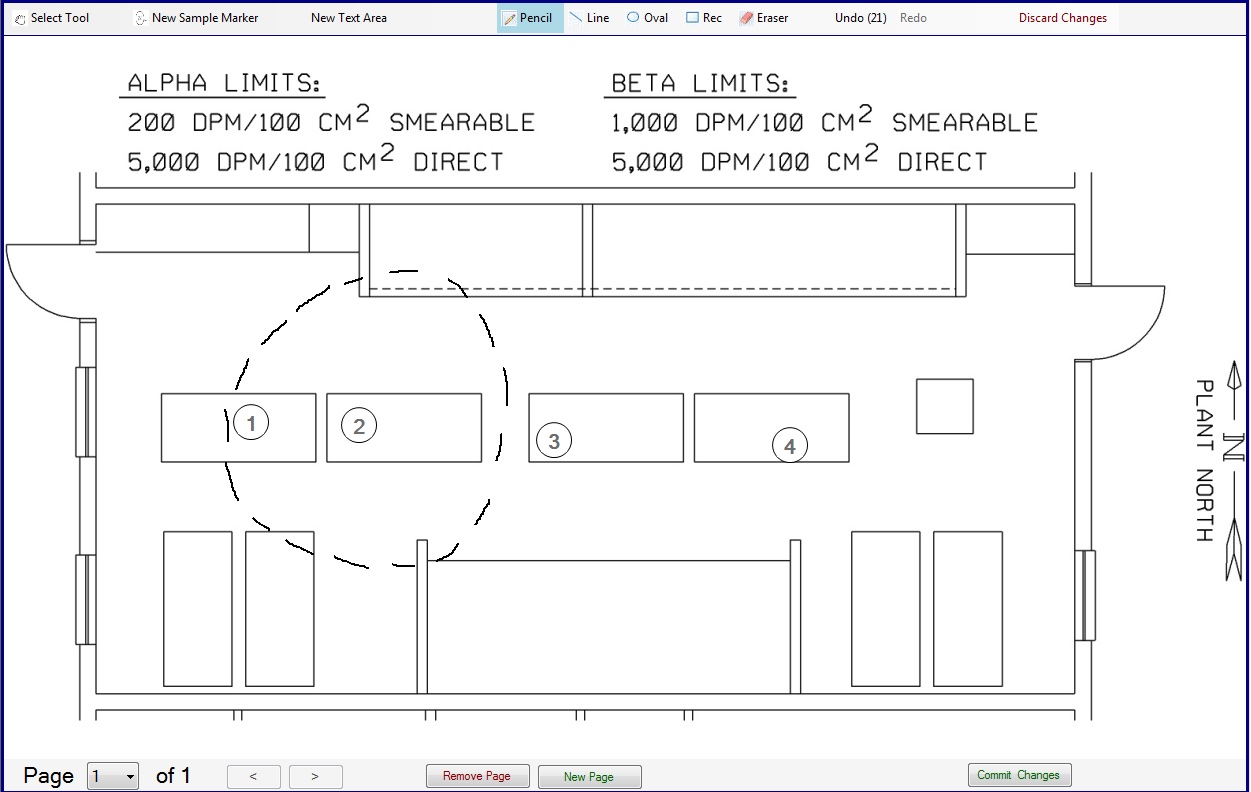
Once the required area survey is identified, technicians select “Save and Continue” to populate an electronic survey form, selected area map, and a unique number is generated and placed on the remote server as a place holder. The unique number is represented in a report generated by supervisors displaying all surveys that are either complete or in progress in real time. These steps may be repeated until all assigned radiation or contamination surveys are loaded onto the tablet, and once complete tablets may be removed from the docking stations for field use. While in the field technicians tap the screen with a stylus or finger to expand the area map to a full screen view with multiple options for drawing, labeling, selecting survey locations, and erasing. When selecting survey locations personnel only need to tap the screen on the desired location to place a number pin, which are automatically numbered sequentially with no limit to the number of pins. (Figure 6)
Once the survey locations, drawings, text, or other information is placed on the map, the user taps a button to save all information. As a failsafe to combat the inadvertent deletion of information or data from a hand or finger on the touch screen, the software will display a confirmation box when any delete or discard action is initiated. Once saved, the user will be brought back to the survey template screen and the template will have automatically place the exact number of rows for survey results that are displayed on the map. (Figure 7) The system counts the number of survey pin drops on the map and adds the correct number of rows correspondingly, and while in the field users may manually input results from field instruments using the text boxes for each row. Also, depending on survey requirements users may elect to count transferable swipes on a Tennelec automated counter and have the count data automatically extracted into the survey form.
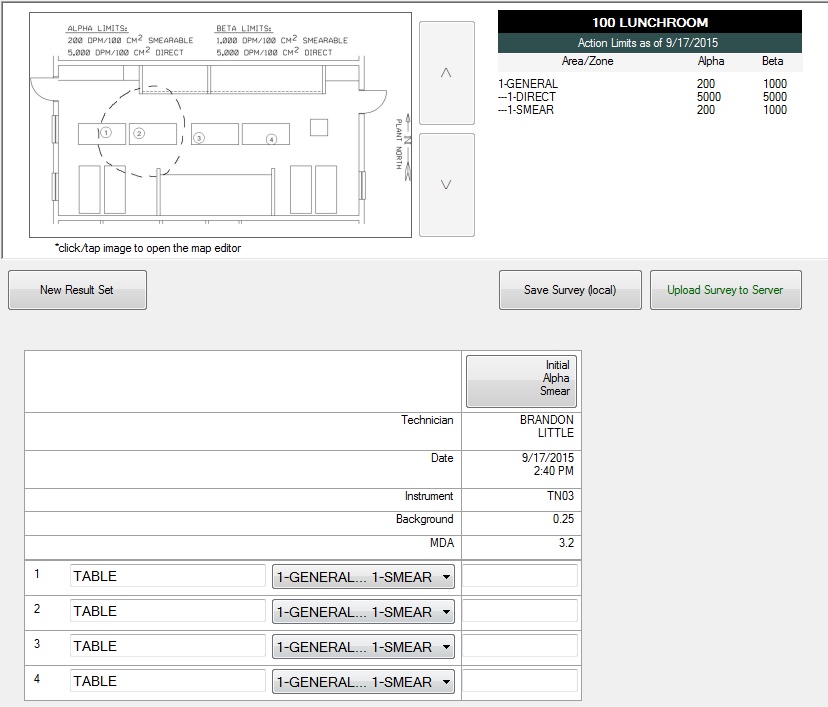
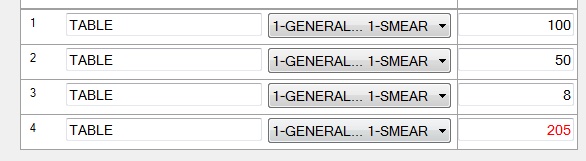
Users begin filling in the text boxes describing the item surveyed, and will select from a drop down list the “Area/Zone” where the survey location was taken. (Figure 8) The “Area/Zones” in the drop down lists have specific limits linked to them, and once data is input into the result boxes the software will validate against those preset limits. When a survey result is greater than the preset limit the result will automatically change color to red as shown below. The software is capable of handling alpha contamination, beta contamination, and gamma dose rate measurement data. All contamination results are automatically recorded as dpm 100 cm-2 and dose rates are automatically recorded in mrem/hr.
Finding a survey result greater than the preset limits initiates the next set of surveys to gather intensives, establish a radius, and determine the extent of contamination. Technicians initiate a new survey within SWIPES but instead of creating a new, independent survey, the follow-on surveys are linked back to the original survey allowing the documentation to tell a “story” of what happened. The hierarchy of the linked surveys continues through multiple levels of a “tree” structure, which provides follow-up surveys to have child surveys where all linked surveys tie back to the original. The levels within the hierarchy are not limited and technicians can go as far as necessary to document contamination.
Once the users complete a survey with the SWIPES Mobile desktop application the survey is uploaded to the server and is fully available for safety supervision, operations, or anyone with access to the system to review or approve depending on permissions. These tasks are completed on an intranet based website portal of SWIPES, which has features similar to the desktop application, but is the primary interface for administrative, security, and approval processes. When logging onto the SWIPES website, which is done automatically by network log on, users are presented with a clean, easy to navigate system. The user has multiple options to review individual surveys, multiple reports, input data, and system and security administration for selected users.
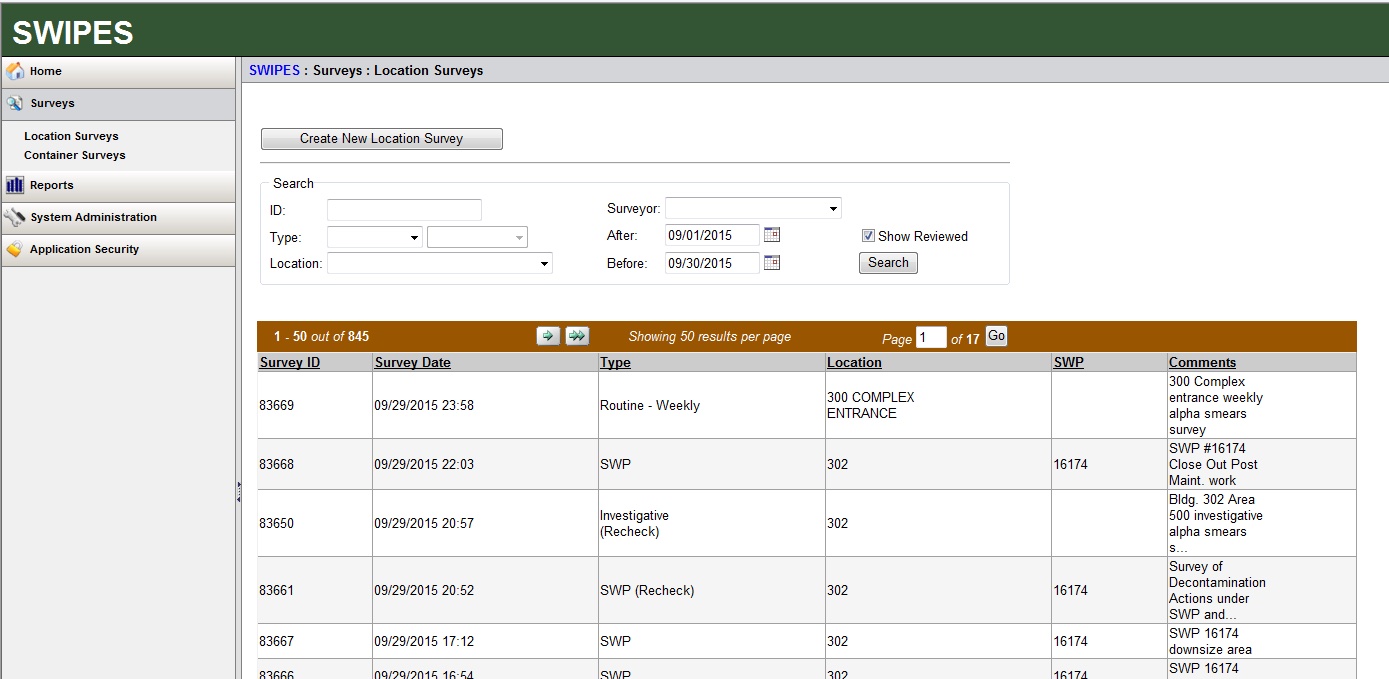
Supervisors can select a particular survey to review or approve by simply clicking on the desired row. This will bring up a Location Survey Details page displaying the survey location, date, time, surveyor, area limits, data results, building map, and if the survey has been reviewed.(Figure 8) When supervisors review a survey their logon credentials are used as a signature attesting to the accuracy review of the survey. The web application acts as a front end interface of SWIPES which connects to a backend Microsoft SQL database logging all transactions and permitting users to query specific sets of data for extraction and further analysis. These features greatly reduced investigations and trending time, and essentially extracts data for analysis in minutes rather than hours. Supervisors and health physics personnel can pull raw data, summaries, trends, outstanding contamination, and graphs for reports, regulators, and auditors quickly and error-free.
Results and Discussion
With any major change of operations or daily business conduct, the buy in of affected stakeholders can determine whether the change or project succeeds. To guarantee success of the project, an introduction of the software progressed with a graded approach to ensure proper testing, writing of procedures and operator aids, and training to ensure personnel using the software were fully comfortable and all questions were answered. Implementation of the software spanned multiple groups with different permission levels within the organization and specific training had to be developed for each affected group. Executing the rollout provided some challenging obstacles to overcome, and although the software design focused on simplicity, changing over to a complete digital system from pen and paper was a paradigm shift for some. The goal was to have an effective switch over from paper to electronic on a specific date without any lapse in fulfilling regulatory requirements.
Recognizing the challenge as a foremost obstacle, classroom training was conducted to walk users through the entire process of creating, editing, linking, and submitting surveys to supervision. Also, users were instructed on every possible scenario they would come across and on the proper steps necessary for compliance. Additionally, a How-To-Guide was published as a supplement to training for users to reference should the need arise. Once training finally completed and all users were competent in using the software, a go live date was determined which would limit the impact of general operations, but also give technicians the time to ensure compliance.
Data collection began immediately upon implementation with impressive results. Supervisors were able to track every survey assigned and watch the progress from radiation technicians throughout the facility in almost real time. Erroneous and incomplete surveys were noticed quickly, corrected, or reassigned to a different technician or shift, as appropriate, and the amount of lost surveys were slashed to zero instantaneously. Personnel throughout various levels of the organization were very receptive to the software, and quickly began to realize how simple the use and how quick learning was. Prior to implementing the software data entry typically ran two to three weeks behind, but post roll-out the data entered was reviewable as soon as completed. Building managers and technical staff are able to pull reports for review an analysis at any time, and can see up-to-date status for the current day. Additionally, users can subscribe to available reports via email and can have a daily report waiting in their inbox when they arrive at work.
Designing important reports for data analysis became a key selling point among management and technical staff whose responsibilities require maintaining up to date metrics. Ensuring the needs of these customers were met, reports were developed to calculate statistics, contamination that requires cleaning, and trending graphs. Table 1 lists the reports available and a brief description/purpose relating to the report.
Table 1: Summary of Available Reports
| Report | Description/Purpose |
|---|---|
| Contamination Survey | Blank survey form developed for print out. |
| Shipping Container Survey | Blank survey form for shipping containers for print out. |
| Incomplete Survey | A report for supervisors to determine any outstanding surveys incomplete. |
| ALARA Contamination Summary | A report that summarizes facility contamination data based on set. search criteria. |
| Location/Area/Zone | A report detailing each buildings contamination action level and the action levels. |
| Outstanding Contaminations | A report providing supervisors and building owners with the details of facility contamination and which locations require cleaning and resurveying. |
| Samples Exceeding Cleanup Levels | A report detailing removable contamination samples that exceeded the area action level. Includes both cleaned and outstanding spots. |
| Summary of Surveys by Location | A report providing an overall summary of Locations, Type, Date/Time, number of samples, and the average per survey. |
| Surface Contamination Trend | A detailed report separating Locations, Areas, Zone, Action Level, percent exceeding action levels, average, and number of samples. |
| Surface Contamination Trend Graph | A graphical representation of the Surface Contamination Trend report. |
Obtaining relevant reports provides investigators and staff the ability to quickly identify areas of concern, unsatisfactory trends, incomplete assignments, and generate data for regulatory questions or defense. Historically, collecting this amount of data would take weeks, and an equal amount of time to assemble and analyze. Presently, the arduous task of collecting data is accomplished in minutes, and analysis can be completed from minutes to hours depending on complexity with much greater accuracy.
Conclusion
The introduction of an electronic survey and data retention system (SWIPES system) generally came with a lot of apprehension because it had never been accomplished at this facility, but given the success of design and rollout, expansion of features and capabilities have been requested by supported organizations to facilitate data transfers between databases. Auditors, investigators, and regulators have expressed how easy it to gather data and the time saved performing their inspections, and greatly assists the technical staff when responding to upset conditions and future work planning. In the profession of health physics, we are looked to by individuals and organizations to solve complex problems, and we should always strive to discover news ways of pioneering changes within the industry. Introducing a new product or method can be a monumental task when opposing forces are consistently reluctant to adapt to change, or when competing stakeholders’ express selfish desires; but these tasks can be overcome if the end result will save money and allow safer, more efficient operations.